
Finding New Paid Media
Growth Curves With AI









-
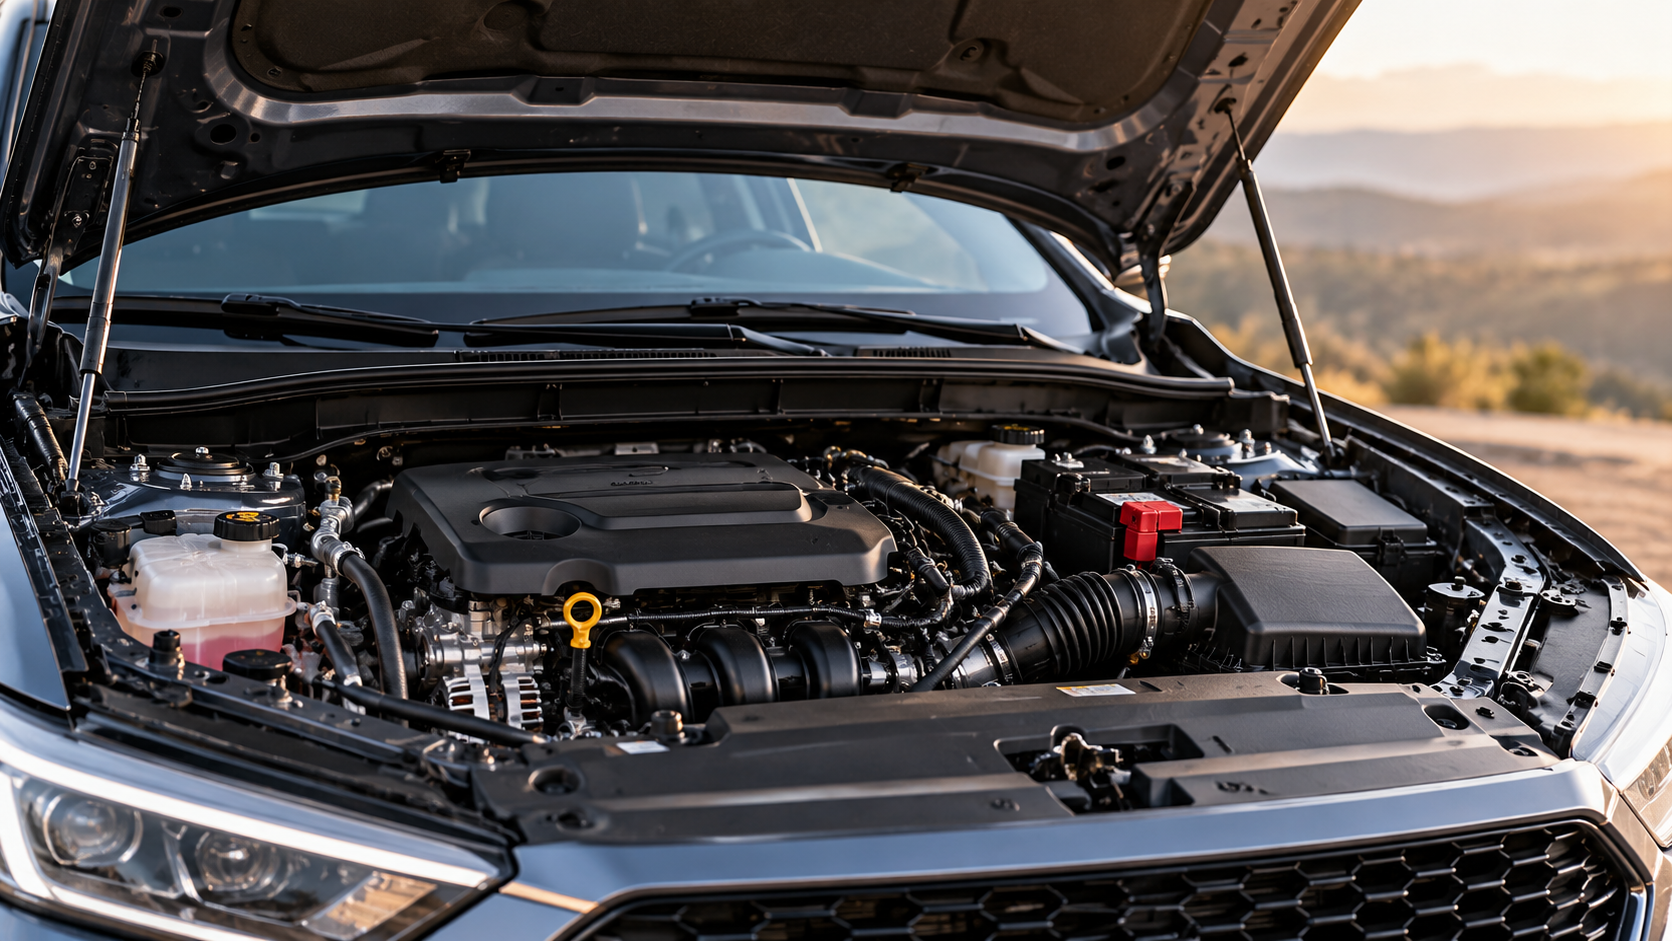 Automotive parts · 9 experiments in 90 days
CarParts.com
Revived 1,100 dead SKUs by feeding predictive audience and geo signals back into PMax, each held to a 5x ROAS floor.
- 39%growth in total orders
- 6.35xrevenue / cost
- $6M+found on 3.5% of budget
-

 Equestrian retail · OMMA 2026 Finalist
Big Dee’s Tack & Vet Supplies
Focused spend on predictive geo and specialty audiences and reactivated high-value, at-risk customers across Google and Meta.
- 8.2xROAS in 90 days
- 83%of tests beat control
- 30+experiments run
-
 Newton Baby
+38% growth in HVCs
+36% increase in AOVHVC-led acquisition found buyers who purchase more items per order.
-
 Steven Singer Jewelers
+66% increase in HVCs
Moved low- and mid-value buyers into higher lifetime value tiers over 12 months.
-
 DECKED
6x ROAS in 2 months
Predictive HVC audiences in PMax, tested against a control baseline.
Why it matters
Every growth curve flattens. Find the next one first.
01
Your current curve has a ceiling
More budget on the same audiences buys less each quarter.
02
The next curve is already in your data
Lapsed customers, overlooked regions and buried products.
03
Experiments make the jump safe
Every test runs against a control. Winners scale, losers stop fast.
Where is your next growth curve hiding?
Find my hidden revenue →

Oops! Something went wrong while submitting the form.